LED Bar Graph
The bar graph - a series of LEDs in a line, such as you see on an audio display - is a common hardware display for analog sensors. It's made up of a series of LEDs in a row, an analog input like a potentiometer, and a little code in between. You can buy multi-LED bar graph displays fairly cheaply, like this one. This tutorial demonstrates how to control a series of LEDs in a row, but can be applied to any series of digital outputs.
This tutorial borrows from the For Loop and Arrays tutorial as well as the Analog Input tutorial.

Hardware Required
Arduino Board
LED bar graph display or 10 LEDs
Potentiometer
10 220 ohm resistors
hook-up wires
breadboard
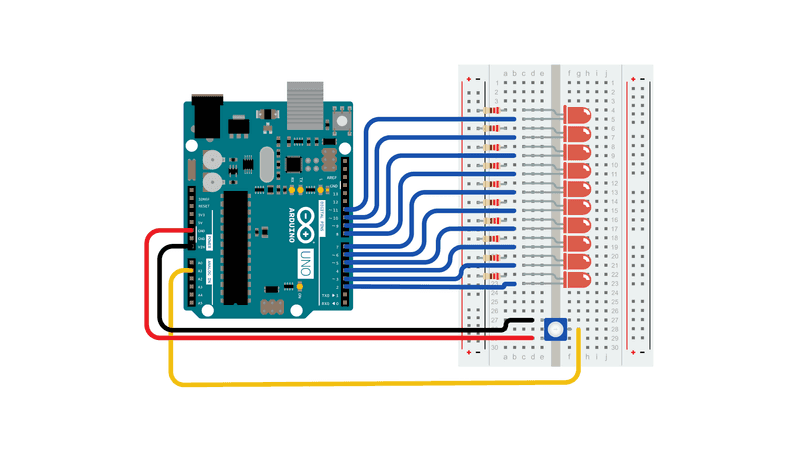
Circuit
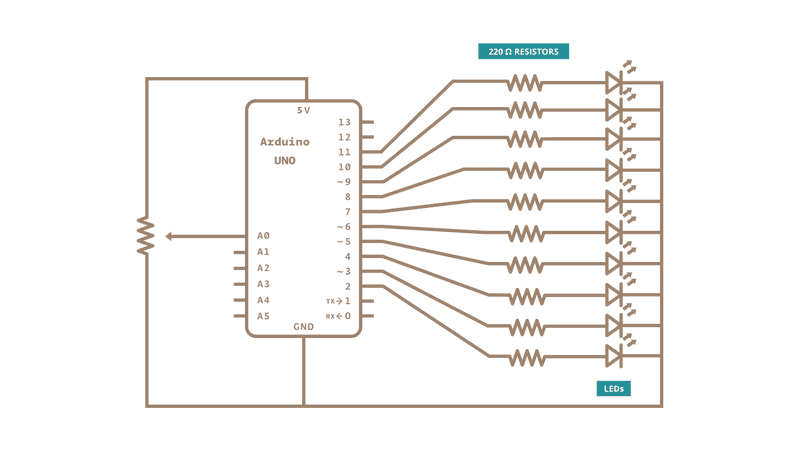
###Schematic
Code
The sketch works like this: first you read the input. You map the input value to the output range, in this case ten LEDs. Then you set up a for loop to iterate over the outputs. If the output's number in the series is lower than the mapped input range, you turn it on. If not, you turn it off.
See Also:
pinMode()
for()
map()
For Loop Iteration - Control multiple LEDs with a For Loop.
Arrays - a variation on the For Loop example that demonstrates how to use an array.
Row Column Scanning - how to control an 8x8 matrix of LEDs.
Last revision 2015/07/28 by SM